I had some problems including a new Z-Wave flood sensor in my openHAB managed smart home environment. While analyzing this, I found out, that there is a very useful log file viewer provided by the author of the Z-Wave binding.
This blog post assumes, that you have an up and running openHAB environment including the Z-Wave binding and one or more Z-Wave devices available. I’ll describe how to configure the logging and how to open your logs in the log file viewer.
Configure the log level
The configuration of the logging mechanisms is described in the openHAB documentation. Normally I do the configuration using the Karaf console. You need to open a terminal on the machine hosting your openHAB instance. Then connect to the Karaf console via ssh -p 8101 openhab@localhost. By default, the password is habopen. This password, the port (here it is 8101) and the username (here it is openhab) might need to be adjusted according to your setup.
  ____  ____  ___  ____  / / / /   |  / __ )
 / __ \/ __ \/ _ \/ __ \/ /_/ / /| | / __  |
/ /_/ / /_/ /  __/ / / / __  / ___ |/ /_/ /
\____/ .___/\___/_/ /_/_/ /_/_/  |_/_____/
    /_/                        2.1.0
                               - release build -

Hit '<tab>' for a list of available commands
and '[cmd] --help' for help on a specific command.
Hit '<ctrl-d>' or type 'system:shutdown' or 'logout' to shutdown openHAB.
Once you are connected, the terminal shows some output similar to the one above. Afterwards, you can set the log level of the Z-Wave binding to debug.
openhab> log:set debug org.openhab.binding.zwave
Please keep in mind, that those changes are lost upon restart. If you’d like to make persistent changes, you can set the log level in a configuration file (located in /var/lib/openhab2/etc/org.ops4j.pax.logging.cfg if you did the setup using the package e.g. provided on Raspbian). For setting the Z-Wave binding log level to debug, you should add a line similar to the one shown below or change the existing one if present.
log4j.logger.org.openhab.binding.zwave = DEBUG
From this time on, more Z-Wave related log messages are written to the log file. It is e.g. located in /var/log/openhab2/openhab.log if your instance is hosted on Raspbian and if you used the available installation package.
Analyze the log file with the log file viewer
The log file produced by openHAB can be analyzed with a log file viewer. It is provided online by the author of the Z-Wave binding.
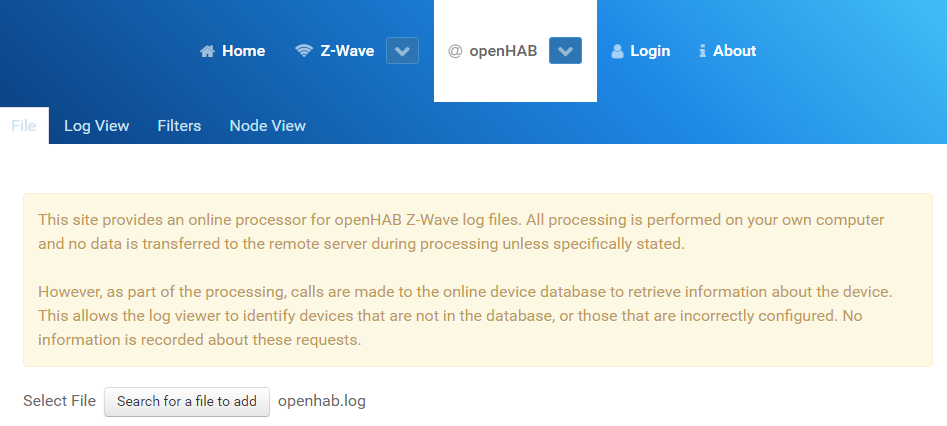
First of all you need to select the log file, which could e.g. be located in /var/log/openhab2/openhab.log. According to the notification shown there, all processing is done on your local machine. There seems to be no upload of your local file unless specifically stated.

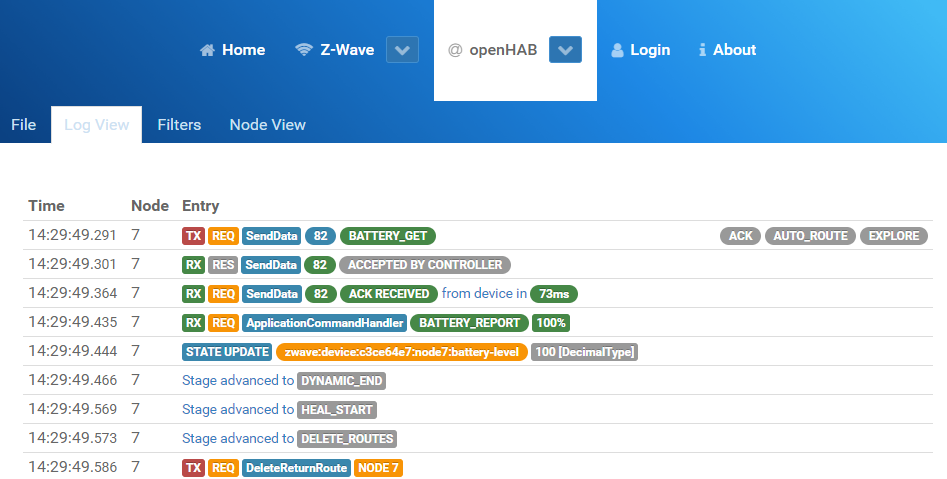
Depending on the size of your log file, processing might take some seconds. Once this finished, you can jump to the log view. It shows Z-Wave related messages contained in your log file in a structured way. From my point of view, this is much more readable and understandable than reading the log messages in a text editor.

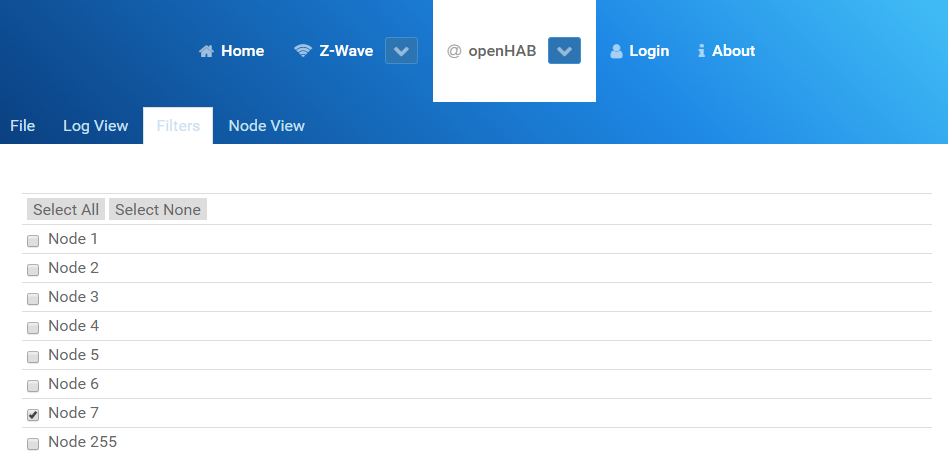
An additional benefit is the possibility to filter the messages by node. This was helpful in my case, because my device was already included in openHAB. Therefore I knew the node ID (shown in Paper UI) and was able to filter the log messages accordingly.

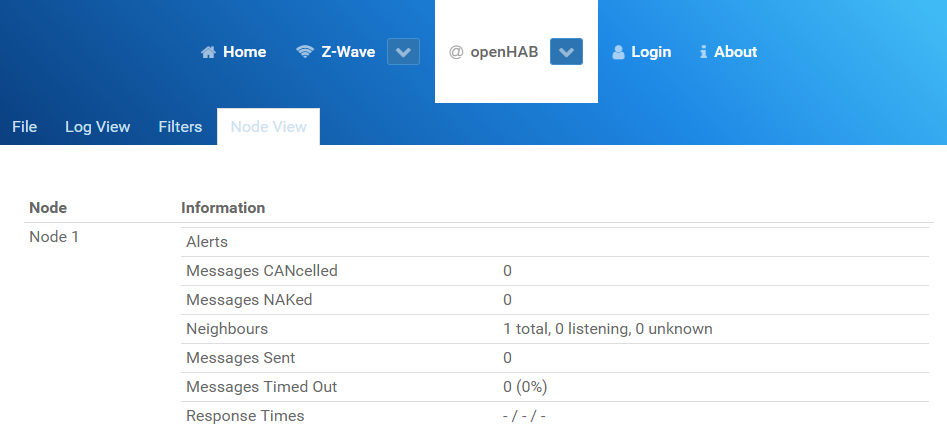
Last but not least, there is some more data related to each node provided in a separate tab.

Conclusion
Besides the possibilty to analyze Z-Wave messages contained in the openHAB log file, the online log file viewer is a great tool for analyzing Z-Wave related problems.